About Cross Tab Reports
A Cross Tab report evaluates data for Talisma base Objects with respect to their Properties.
For example, Interaction is an Object, and Assigned to is one of its Properties, and it represents the person to whom the Interaction is assigned.
A Cross Tab report uses a tabular format, and displays information in rows and columns. The report can be generated based on data pertaining to one Team, or a set of Teams. A Cross Tab report uses a base Object, for example, Opportunity. The report displays Properties of the base Object in the header row and the values in the column, or vice versa, based on your preferences.
|
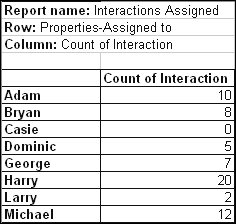
Example You want to find out the number of Interactions assigned to each User in the Customer Support Team. You can create a Cross Tab report using Interaction as the base Object and Assigned to as the Property defined along rows. Your report will look like this:
|
You can create a Cross Tab report by specifying the Object Properties to be displayed along rows and columns. The specified Property name is displayed as the header row or the header column. In the above example, the values for the Property Assigned to (names of Users in the Customer Support Team) are displayed along rows. These values collectively represent the header column.
You can customize a Cross Tab report by creating user-defined rows or columns to display the required Properties. However, you cannot customize both rows and columns for a report.
|
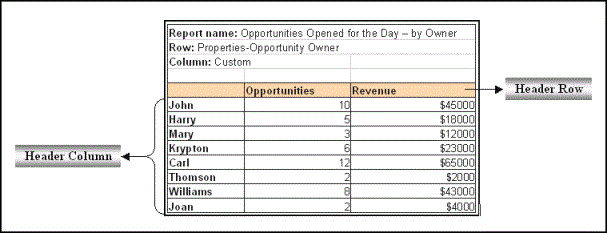
Example When you want to track the performance of sales representatives in your Team, you can generate a Cross Tab report using Opportunity as the base Object. If you want the report to display the names of the sales representatives in the rows, you can set Owner (which is a Property of the Opportunity Object) along rows. You can then customize columns to display the Count of Opportunities owned by each representative, and the corresponding Revenue amount. The representative with the highest Opportunity count and maximum revenue is the best performer. |
Cross Tab reports can calculate mathematical functions in the customized rows or columns. The mathematical functions include count of the selected Objects, sum, average, minimum, and maximum.

Sample Cross Tab Report
In the above example, columns are customized to display the count of Opportunities and their corresponding revenue. The column names Opportunities and Revenue represent the header row.
A Cross Tab report can also display information about Properties of an Object related to the selected base Object.
|
Example When you select Opportunity as the base Object in a Cross Tab report, you can specify a Property of the Contact Object to be displayed in the same report. Here, Contact is an Object related to the base Object Opportunity. |
Elements of the Cross Tab Report Wizard
You must follow a step-by-step procedure while generating a Cross Tab report. Talisma provides you with a wizard using which you can easily create Cross Tab reports. The following table describes the elements of the Cross Tab Report Wizard:
|
Element |
Description |
|
Base Object |
The base Object is the Talisma Object for which you are generating the report. The available Talisma Objects are Account, Campaign, Canned Response, Contact, Interaction, Message, Opportunity, Order, Product, Target, User, Visitor, and any custom Object. Example You want to generate a report to track the performance of customer support representatives (CSRs) in your company. You can choose Interaction as the base Object and generate a report that provides a count of the Interactions resolved by each CSR. |
|
Teams |
You can specify the Teams from which data must be included in the report. The Teams page of the wizard displays the list of Teams in which you have the Manage Analytics Permission. Example As manager of the Marketing Team, you are responsible for generating reports to monitor the effectiveness of marketing Campaigns launched by your organization. While generating the Campaign Effectiveness report, you want to include information about sales Opportunities generated by the Campaign, and the names of the sales representatives who handle those Opportunities. You can select the Marketing Team and the Sales Team from the Include data from the following Team(s) list. |
|
Rows and Columns |
Rows and Columns can represent: • A Property of the selected Object. Example Select the Owner Property for the Opportunity Object. The names of the Opportunity owners will be displayed along the header row or header column of the report. • A computation (count, mathematical function of a numeric Property, or time taken for the value of an enumerated Property to change) of data for the Object you selected. Example Set Count of Opportunity as the value to be calculated when the report is generated. |
|
Filter |
A Filter enables you to define the Object items on which the report is based. Example You are creating a report to view the number of Opportunities created by each sales representative in your Team. You can define a Filter that restricts the data to the Opportunities created in the last two weeks, by specifying the condition Opportunity: Open Date: in: Last 2 Weeks. |
|
Options |
You can set specific options for the reports that you generate. These options include: • Selecting the folder in which the report must be saved. Example You are generating a report to track the number of pending Interactions that require immediate action. You can save the report under a folder named For Immediate Action. • Adding a report to the Favorites folder. • Defining the intervals at which the data in the report must be refreshed. Example You can specify that the data in your report must refresh every thirty minutes. • Specifying whether the report must be run immediately. You can choose to run the report immediately, or save the report and run it later using the Run Latest button. |
