The Analytics Workspace
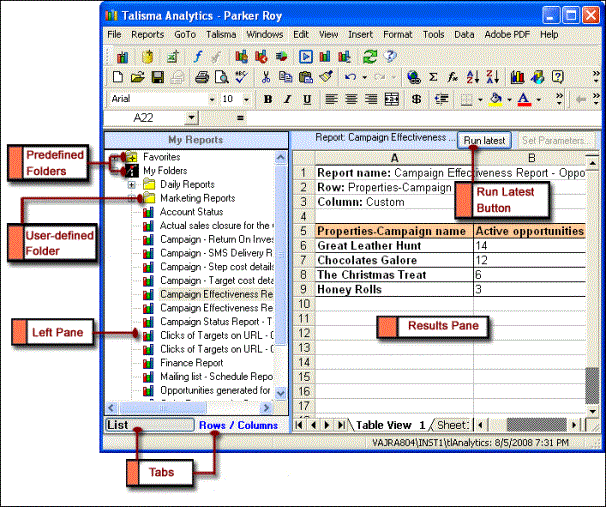
The Talisma Analytics Workspace provides an interface to create and view comprehensive reports. The window is split into two - the My Reports pane and the Results pane.
The My Reports pane (or the Left pane) lists all the reports (predefined and user-defined), and the Favorites folder to which you can add your frequently-used reports. It also lists the other predefined folders. The Results pane displays the selected report. If a selected report has not been run, the Results pane displays the message, "This report has not been run. Click Run Latest to run it." The report is displayed using Microsoft® Excel.
In any Workspace, select Analytics from the GoTo menu, to go to the Talisma Analytics Workspace.

The Analytics Workspace
The following table describes the components of the Talisma Analytics Workspace:
|
Component |
Description |
|
Menu Bar |
Contains commands to perform operations on reports in Talisma Analytics. |
|
Toolbar |
Displays the most frequently performed tasks as icons. |
|
My Reports pane / Left Pane |
Displays the list of predefined and user-defined Folders in which you can save your reports. Favorites and My Folders are predefined Folders. You can create any number of user-defined Folders. You can view the list of reports in a folder by clicking the plus sign (+) next to the folder name to expand it. When you run a Cross Tab report, the My Reports pane displays the Rows / Columns tab along with the List tab. When the TalismaAdmin User logs on, the My Reports pane displays the list of predefined reports available in Talisma. The My Reports pane is also called the Left pane. |
|
Tabs |
The My Reports pane displays the List tab by default. The Rows / Columns tab is displayed when you run a Cross Tab report. When you run a Drill Down report, a Microsoft Excel report or a Microsoft SQL report, the Rows / Columns tab is not displayed. • In the List tab, you can view the list of reports available to the selected Team. • In the Rows / Columns tab, you can select the items to be displayed in the rows and columns when you generate the report. You can also choose to hide the rows and columns whose value is zero. This tab is displayed only when you run a Cross Tab report. |
|
Results pane |
Displays the selected report as a table in Microsoft® Excel. |
|
Status Bar |
Displays the name of the selected report, and details such as the date and time when the report was last run. |
|
Run latest button |
This button is available next to the Status Bar above the Results pane of the Talisma Analytics Workspace. The Run Latest button enables you to run and view a selected report with the latest data. |