Semantic Layer
Student Analytics Online Analytical Processing (OLAP) layer uses the Analysis Services platform in tabular mode (Tabular Models)
Tabular models are in-memory databases in Analysis Services.
The BI semantic tabular model deployed on the Analysis Service for Anthology Student is configured to process and contain the data from the data warehouse.
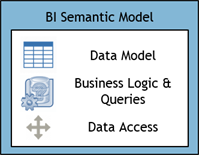
This semantic model consists of dimensions and facts from the data warehouse (data access) and various measures applied across the facts (business logic and queries), facilitating data analysis from various perspectives. Examples include conversion rates, year-to-date totals, year-over-year growth rates, and so on, across the Campus dimension or Program dimension.
Student Analysis on Cloud 1.0 and On-Premises
-
Uses the SQL Server Analysis Services (SSAS) platform in tabular mode (SSAS Tabular).
-
The BI semantic tabular model is deployed on SSAS for Anthology Student and/or CampusNexus CRM.
-
Separate semantic tabular models are implemented for Anthology Student and CampusNexus CRM to address specific analysis needs.
Student Analytics on Cloud 2.0
• Uses the Azure Analysis Services platform in Tabular mode.
• The semantic model is hosted on the Azure cloud platform, enabling scalability and cloud-native features.
Designed to leverage cloud capabilities for enhanced performance, accessibility, and integration with other cloud services.
List of Semantic Models
The table below contains the list of semantic models available to address specific modules of Anthology Student and CampusNexus CRM.
| Semantic Model Name | Product | Module |
|---|---|---|
| Model | Anthology Student | Admissions & Academics |
| Financial Aid Model | Anthology Student | Financial Aid |
| Campaign Model | CampusNexus CRM | Campaigns |
| Career Services Model | Anthology Student | Career Services |
| Student Accounts Model | Anthology Student | Student Accounts |
| Contact Manager Model | Anthology Student | Contact Manager |
Each of the semantic models contains measures (also called calculated fields) that are created using Data Analysis Expressions (DAX) formulas. These measures are placed in the VALUES area of a report, where the X or Y axis labels that surround it provide the context of the value.
Example:
The "Conversion Rate %" measure in the "Prospect Status Progression" measure group, when used against the Lead Year, filtered by Year 2010 to 2016, would calculate the value, at run time, based on the given Lead date and year.
Customize Retention Days, Fiscal Period, and Academic Year
As part of the initial data load, you can customize the retention days for the staging table, offsets for fiscal periods, and offsets for academic years.
-
The retention days value determines how many days data is kept in the staging table before the data is deleted.
-
The fiscal period and academic year offset values determine the beginning and end of the fiscal and academic year periods.
You can choose values that match the needs of your institution. For more details, see Analytics Post Installation Tasks in Installation Manager Help.
List of Measures and Expressions
The Excel file Measures and Expressions in Analytics 25.1.0.xlsx contains the complete list of measures for Anthology Student along with the DAX expressions used to calculate the measures.