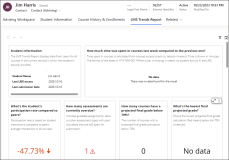
LMS Trends Report
When the LMS Trends Report is enabled in Anthology Reach, the out-of-the-box Contact (Advising) form displays the LMS Trends Report tab, which provides advisors and coaches access to detailed and timely information about student's course performance and engagement at their fingertips.
The LMS Trends Report includes vital information from Blackboard Learn about individual students' engagement and performance in their current courses. Reach users can leverage this information for meaningful and proactive conversations with their students.
The following topics provide information on the steps to view the LMS Trends Report tab and the data and charts that are available in the LMS Trends Report.
-
In the Anthology Reach environment, view the Contacts page.
-
Select a Contact record and select the Contact - Contact (Advising) form.
-
Click the LMS Trends Report tab.
The reports are displayed in the LMS Trends Report tab.
-
To download and view a PDF version of the LMS Trends Report perform the following steps:
-
Click the download icon,
 , displayed on the top right corner of the LMS Trends Report page.
 -
Click the Generate PDF option to generate the PDF file.
-
After the PDF is generated, click the DOWNLOAD button to download the PDF file.
-
The following table provides information on the various charts that are available in the LMS Trends Report .
| Reports Element | Description | Image |
|---|---|---|
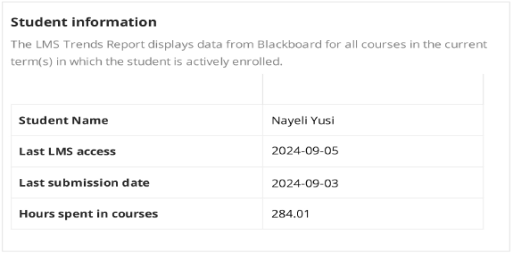
| Student information |
Displays student name, last LMS access date, and last LMS submission date, and total hours spent in courses. The report only includes data from courses in an active term (where the current date is within the start and end dates) in which the student is actively enrolled (not withdrawn). |
|
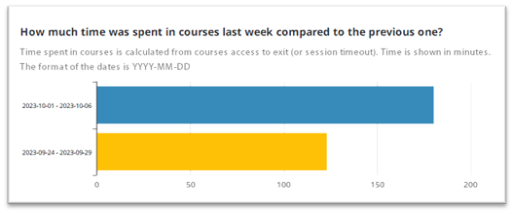
| How much time was spent in courses last week compared to the previous one? | Time spent in courses is calculated from courses access to exit (or session timeout). Time is shown in minutes. The format of the dates is YYYY-MM-DD. Note: When a bar is missing, it means there is no student activity in the LMS. |
|
|
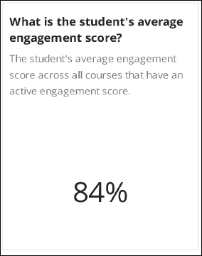
What's the student's average engagement score? |
The student’s average engagement score across all courses that have an active engagement score. For information about the engagement score, see Engagement Score. |
|
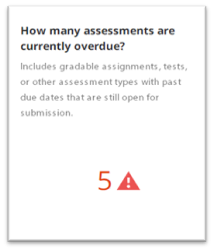
| How many assessments are currently overdue? |
Includes gradable assignments, tests, or other assessment types with past due dates that are still open for submission. Assignments are considered overdue when the attempted time is null and the current time is greater than the due date time. |
|
| How many courses have a projected final grade below 70%? |
The number of courses with a projected final grade calculation below 70%. Projected final grade is the final grade in the gradebook. This metric is a count of courses where the final grade is below .70. |

|
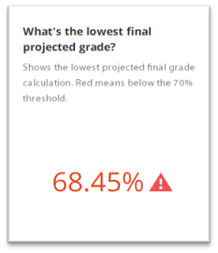
| What's the lowest final projected grade? |
Shows the lowest projected final grade calculation. Red means below the 70% threshold. Projected final grade is the weighted average grade in the gradebook. This chart displays the lowest final grade from all the students’ active courses in the current term. |
|
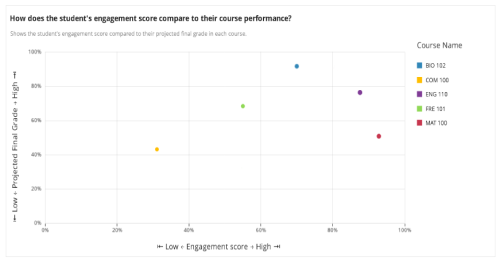
| How does the student’s engagement score compare to their course performance? | Shows the student's engagement score compared to their projected final grade in each course. |
|
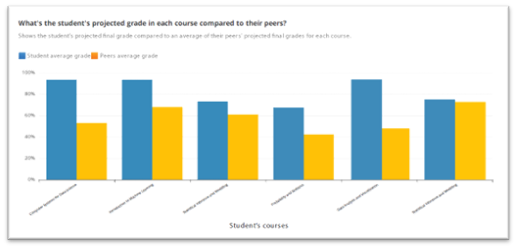
| What's the student's projected grade in each course compared to their peers? | Shows the student's projected final grade compared to an average of their peers' projected final grades for each course. |
|
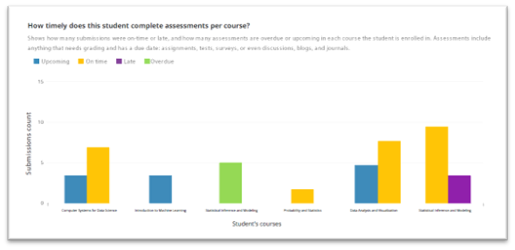
| How timely does this student complete assessments per course? | Shows how many submissions were on-time or late, and how many assessments are overdue or upcoming in each course the student is enrolled in. Assessments include anything that needs grading and has a due date: assignments, tests, surveys, or even discussions, blogs, and journals. |
|
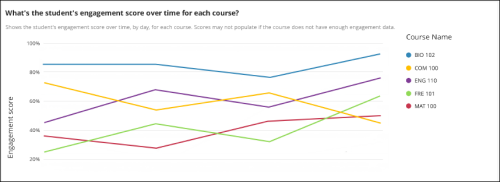
| What’s the student’s engagement score over time for each course? | Shows the student's engagement score over time, by day, for each course. Scores may not populate if the course does not have enough engagement data. |
|
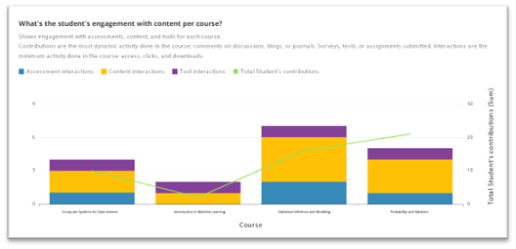
| What's the student's engagement with content per course? |
Shows engagement with assessments, content, and tools for each course. Contributions are the most dynamic activity done in the course: comments on discussions, blogs, or journals. Surveys, tests, or assignments submitted. Interactions are the minimum activity done in the course: access, clicks, and downloads. |
|
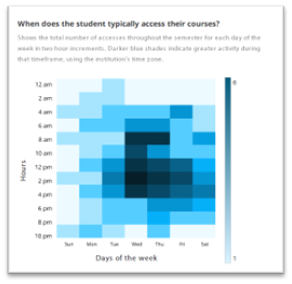
| When does the student typically access their courses? | Shows the total number of accesses throughout the semester for each day of the week in two hour increments. Darker blue shades indicate greater activity during that timeframe, using the institution's time zone. *When a day is missing, it means no student activity in the LMS. |
|
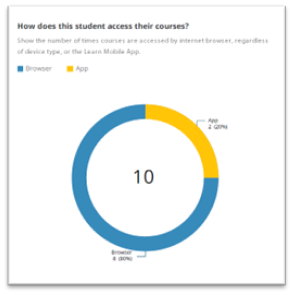
| How does this student access their courses? | Shows the number of times courses are accessed by internet browser, regardless of device type, or the Learn Mobile App. |
|
| Additional course details | Shows additional information about each course and the student's engagement and performance. Includes term, course ID, course name, course enrollment count, total content items in course, total assessments in course, student’s first access, student’s projected final grade, student’s engagement score, and engagement score status. |

|
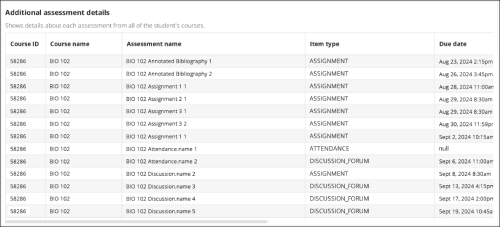
| Additional assessment details | Shows details about each assessment from all the student’s courses. Includes course ID, course name, assessment name, item type, due date, submission date, student’s grade, and peer’s average grade. |
|
Engagement Score
The engagement score is a comprehensive metric derived by a machine learning algorithm from multiple LMS activity data points that takes into account the engagement expectations of each course. The engagement score includes accesses, minutes in course, discussion forum interactions, course content interactions, and submissions.
The engagement score will not appear until there is enough activity in the LMS to generate a meaningful score. It may not appear for certain courses with durations that are over a year or shorter than a month. In the Additional Course Details table, an engagement score status is displayed for each course. The status can be Active, Waiting, or On Hold. A score will not appear unless the status is Active.
